
Cut Elastic
Indexing By Half
Optimize at the edge to cut costs 50%.Stream from S3 on-demand to reach 80%+
Cut Indexing Costs
Filter, regulate, and optimize events before they reach Elasticsearch
Dev
Preview savings
Elastic
Pinpoint waste
Edge
Optimize at source
Storage
Ingest on-demand


Simple Pricing
One question: How many nodes run log collection?
| Tier | Nodes | Annual Price |
|---|---|---|
| Starter | up to 50 | $15,000 |
| Growth | up to 300 | $35,000 |
| Business | up to 750 | $65,000 |
| Enterprise | up to 1,500 | $105,000 |
| Enterprise+ | 1,500+ | Contact us |
All tiers include unlimited log volume, all products, and all features. See all tiers →
Elastic Integration
Works with Elastic Cloud, self-hosted, OpenSearch, Coralogix, and Logz.io.
Zero changes to mappings, templates, or queries
Zero Changes
Full Compatibility
Elasticsearch Plugin
Frequently Asked Questions
Getting Started
- Dev — Run on your Elasticsearch log files locally. One-line install, results in minutes. No account, no credit card.
- Cloud Reporter — Connect to your Elasticsearch cluster via REST API. See which event types cost the most — no agent changes.
- Edge apps — Deploy optimizer and regulator via Helm chart alongside your forwarder. ~30 min setup.
- Storage Streamer — Route events to S3, stream selected data to Elasticsearch on-demand.
Each step is independent — start with Dev to see your reduction ratio, then move to production when ready.
Yes. Log10x operates pre-ingestion — events that pass through arrive in standard Elasticsearch format. Kibana dashboards, saved searches, KQL queries, visualizations, and alerts all work unchanged. Zero reconfiguration.
All field mappings, index patterns, and document structure are preserved. Edge Reporter and Edge Regulator output standard Elasticsearch documents. Edge Optimizer compacts events losslessly — the open-source L1ES plugin transparently rewrites standard queries and decodes _source at search time for self-hosted Elasticsearch 8.17 and OpenSearch 2.19. For managed services, Storage Streamer expands events from S3 before ingestion.
~1.25x query time. The open-source L1ES plugin expands compact events at the Lucene segment level — each shard handles its own expansion locally with no central bottleneck.
A query that takes 100ms on standard events takes ~125ms on compacted events. On a 2-second search across 10M documents, that's 2.5 seconds. Aggregations, highlighting, _source retrieval, and KQL queries all work through the plugin unchanged.
Expansion scales horizontally with your cluster — adding nodes reduces per-shard work the same way it does for standard queries.
Yes. Log10x runs as a sidecar alongside your existing forwarder — it doesn't replace Logstash, Beats, or any part of your pipeline.
Your Logstash pipelines, Beats modules, and Elasticsearch ingest nodes all continue unchanged. Log10x intercepts events at the forwarder output, optimizes them, then forwards to the Elasticsearch Bulk API. Nothing to reconfigure in Logstash, Beats, or your ingest pipelines.
Supported: Filebeat, Metricbeat, Logstash 7.x/8.x, Fluent Bit, Fluentd, and OpenTelemetry Collector.
All of them. Log10x works pre-ingestion — it optimizes events before they reach any Elasticsearch-compatible backend.
| Platform | Versions |
| Elastic Cloud | All regions, all tiers |
| Self-hosted Elasticsearch | 7.x, 8.x (including open-source) |
| OpenSearch | 1.x, 2.x (AWS and self-hosted) |
| Coralogix | Elasticsearch-compatible ingestion |
| Logz.io | Elasticsearch-compatible ingestion |
Same optimization pipeline, same forwarder sidecar, same results — regardless of where your Elasticsearch runs.
The Edge Optimizer losslessly compacts events at the forwarder before they ship to Elasticsearch. From there, three paths:
1. Stream raw to S3 — The Storage Streamer sends events to Elasticsearch on demand. S3 storage costs ~90–95% less per GB than Elasticsearch indexing.
2. Stream optimized to S3 — 50–60% smaller footprint. The Storage Streamer expands events before sending to Elasticsearch. Zero query-time overhead.
3. Index optimized in Elasticsearch (self-hosted only) — Send optimized events directly to Elasticsearch. The L1ES plugin expands at query time (~1.25x overhead). The tradeoff: 50–60% less index storage and hardware for on-prem deployments. Optionally store a copy in S3 for long-term retention.
Paths can be combined — for example, index optimized in Elasticsearch for hot data while storing optimized events in S3 for long-term search.
Managed platforms (Elastic Cloud, AWS OpenSearch Service, Coralogix, Logz.io): paths 1 and 2. Custom plugins are not available on managed platforms, so the Storage Streamer handles expansion before ingestion.
All 10x apps deploy in your infrastructure — no data leaves your network. Most teams adopt in three steps:
-
Cloud Reporter — samples your Elasticsearch cluster API to pinpoint which indices and source types cost the most. Runs as a Helm CronJobCloud Reporter — Helm CronJob:
log10xLicense: "YOUR-LICENSE-KEY"

jobs:
  - name: reporter-job
    runtimeName: my-cloud-reporter
    schedule: "*/10 * * * *"
    args:
      - "@apps/cloud/reporter"
Full deploy guide → in your cluster. -
Edge Optimizer — losslessly compacts logs at the source before they reach Elasticsearch. Add a tenx blockEdge Optimizer — Helm values:
tenx:
  enabled: true
  apiKey: "YOUR-LICENSE-KEY"
  kind: "optimize"
  runtimeName: my-edge-optimizer
Filebeat · Fluent Bit · Fluentd · OTel Collector · LogstashFull deploy guide → to your existing forwarder Helm values; CLI or Docker for VMs. -
Storage Streamer — stores logs in S3 and streams selected events back to Elasticsearch on demand. Deploy via a Terraform moduleStorage Streamer — Terraform:
module "tenx_streamer" {
  source       = "log-10x/tenx-streamer/aws"
  tenx_api_key = var.tenx_api_key

  tenx_streamer_index_source_bucket_name = "my-app-logs"
}
Full deploy guide → that provisions S3 buckets, SQS queues, and IAM roles.
Cost & Savings
Yes. Storage Streamer indexes your logs in S3 and streams matching events to Elasticsearch when you need them — for incidents, scheduled dashboards, compliance audits, or metric aggregation.
Query workflow: Send a REST API call with a time range and search expression. The Bloom filter index identifies matching S3 files in <1 second. Matching events stream to Elasticsearch via the Bulk API with original timestamps — they appear in Kibana alongside your live data. ~100 events in 2-5 seconds, ~10K events in 10-30 seconds.
No separate UI to learn — results are standard Elasticsearch documents. Search, filter, and dashboard them the same way you always do. For recurring workflows, schedule queries via Kubernetes CronJob.
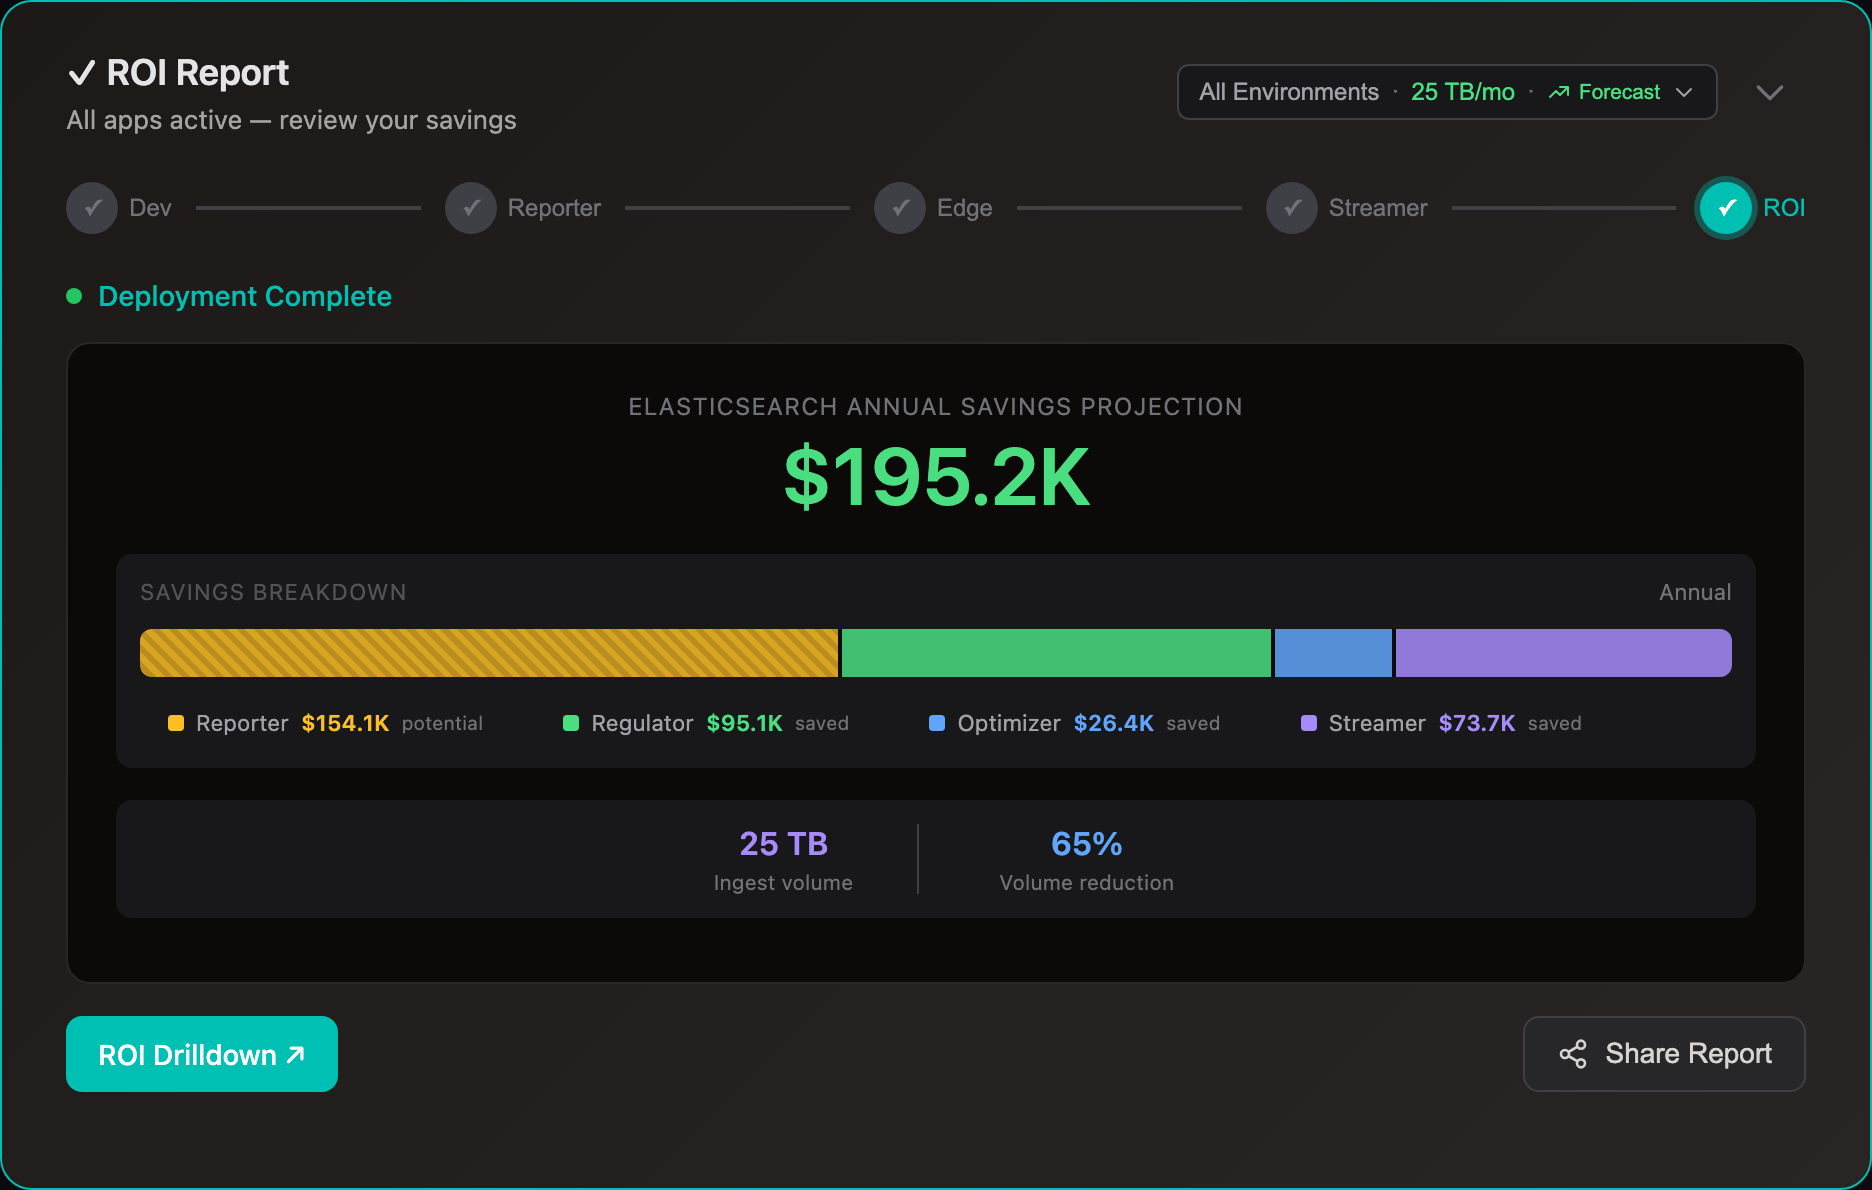
Most customers divert 80% of volume to S3. A 2 TB/day Elasticsearch cluster saves ~$840K/yr.
Elasticsearch costs scale with index volume — more shards, more storage, more compute. Whether self-hosted or Elastic Cloud, reducing what you index directly cuts costs.
With Edge Optimizer (50%+ lossless reduction): index volume drops ~50%. Same data, fewer bytes. No data loss, all fields preserved.
With S3 streaming: route low-value logs to S3 at $0.023/GB and stream to Elasticsearch only when you query — for incident investigation, dashboard population, compliance audits, or metric aggregation. See use cases for Elastic-specific savings examples.
For most self-managed clusters, data node count is driven by storage capacity. The relationship is roughly linear: 50% less indexed volume ≈ 50% fewer data nodes.
Example — 30 data nodes, 10TB/day, 7-day hot retention:
| Before | Optimizer (50%) | + Streamer (80%) | |
|---|---|---|---|
| Daily indexed | 10TB | 5TB | 2TB |
| Hot storage (7d × 1 replica) | 140TB | 70TB | 28TB |
| Data nodes | 30 | 15 | 6 |
| Monthly data node cost | ~$25,000 | ~$12,500 | ~$5,000 |
| S3 archive (30d) | — | — | ~$6,900 |
Each decommissioned node removes both its EC2 instance and its EBS volume. Master nodes (typically 3), coordinating nodes, and Kibana stay unchanged.
Comparisons
ILM moves data to cheaper tiers after you’ve already paid to index every byte. Log10x cuts what gets indexed — fewer nodes, less compute, less hot-tier SSD from day one.
| Elastic ILM | Log10x | |
| When | After ingestion | Before ingestion |
| What | Move data to cheaper tiers | Reduce volume 50%+ before indexing |
| Ingestion cost | Full volume indexed | Only optimized volume indexed |
| Hot tier | Full volume on SSD | 50%+ less SSD required |
Both kick in after ingestion — you still pay full compute and node costs to index every byte. Neither reduces your node count.
| Logsdb | Searchable Snapshots | Log10x | |
| When | After indexing | After indexing | Before indexing |
| Reduces | Disk footprint (columnar encoding) | Lifecycle storage (S3 frozen tier) | Ingestion compute + storage + nodes |
| Ingestion cost | Unchanged | Unchanged | 50%+ less |
| Node count | Unchanged | Unchanged | Fewer nodes needed |
Cut Your Log Costs
Sign up, connect your Elastic environment, and see savings.Elastic Cloud · Elastic/OpenSearch · Coralogix · Logz.io