
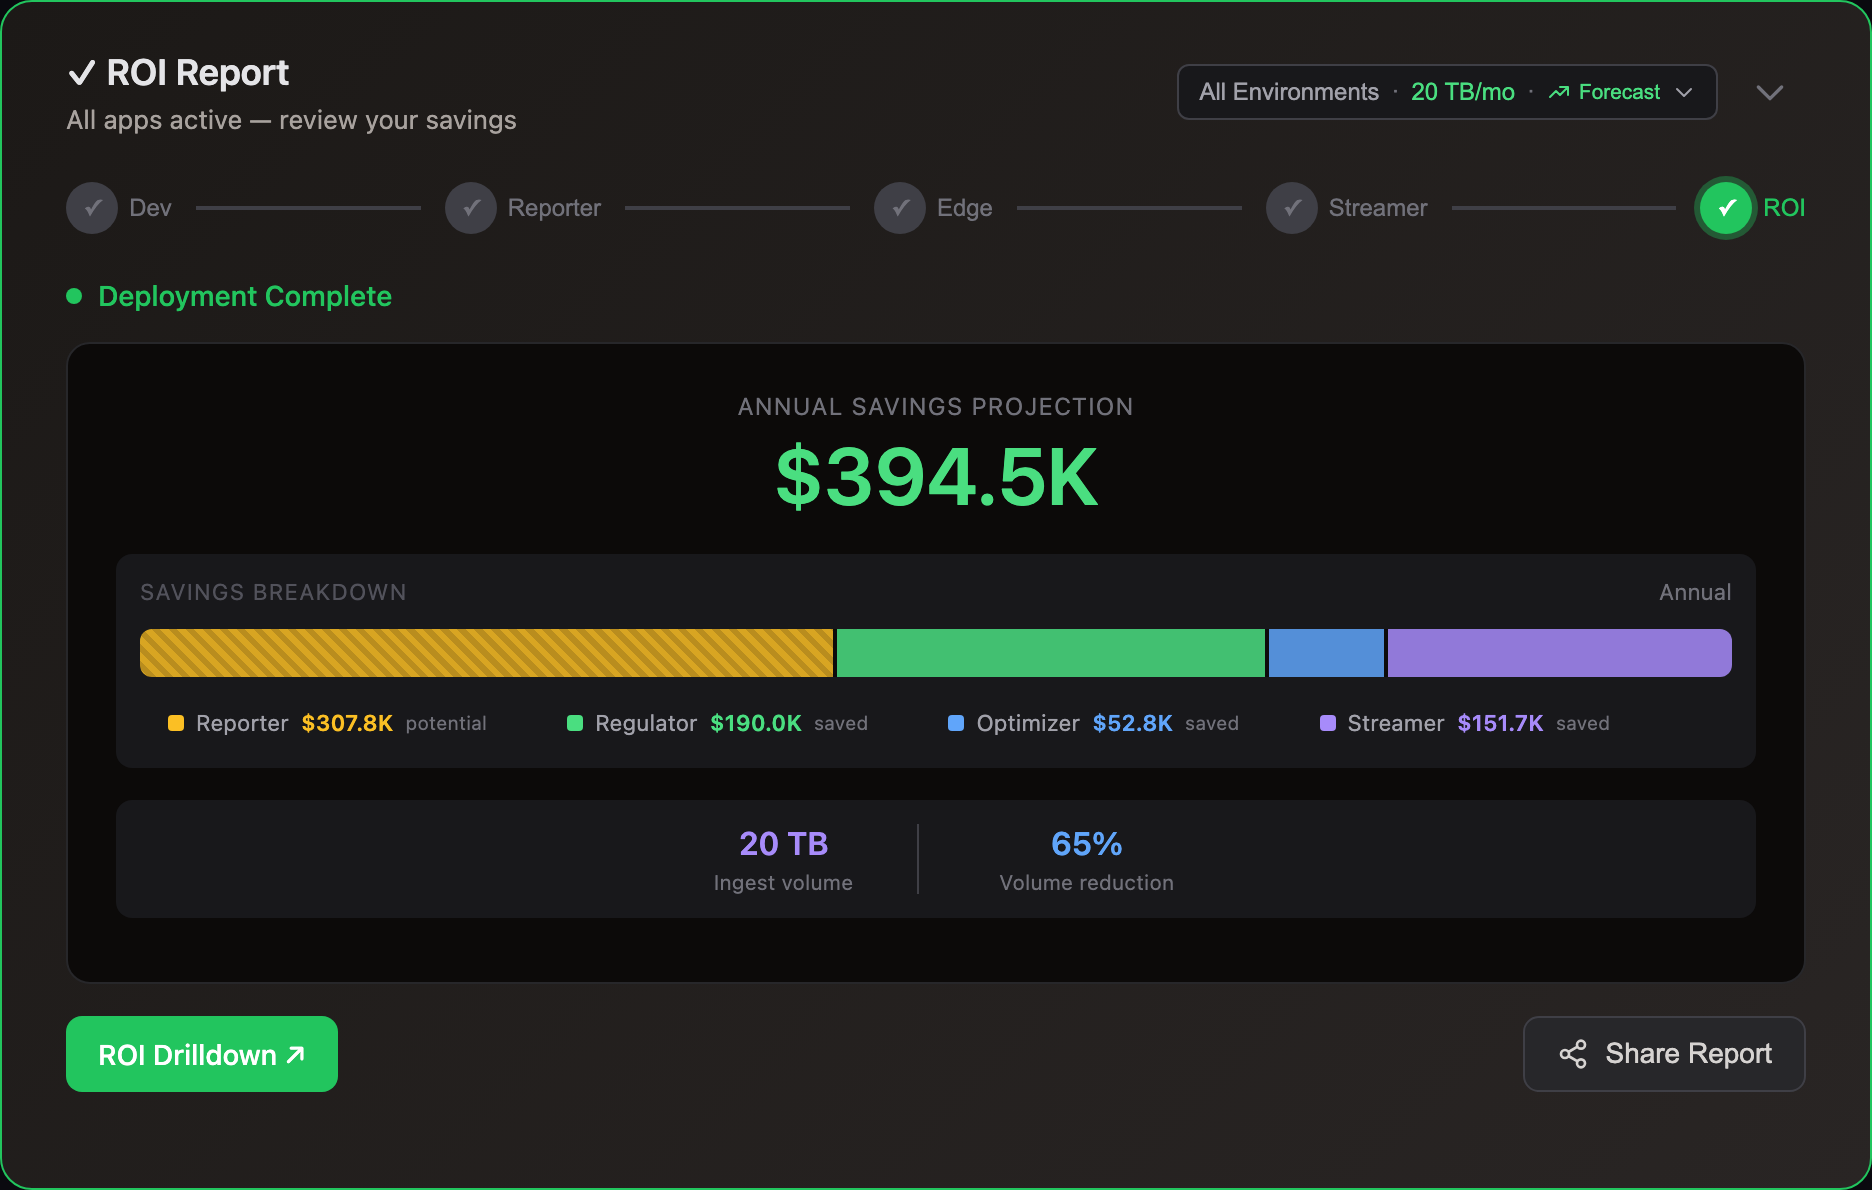
Cost Breakdown
Know Where to Cut
Pinpoint event types driving 80% of cost inSplunk · Datadog · Elasticsearch · CloudWatch Logs


Cloud Reporter Workflow
See the event types costing you the most. Agentless, 5min setup
Hover over each step to learn more
Frequently Asked Questions
How It Works
Cloud Reporter classifies every indexed event by its event typeEach log event is automatically classified by its stable message structure — variable data stripped, pattern preserved:
Raw log event:[2025-08-01 22:19:30,905] INFO [controller-1-to-controller-registration-channel-manager]: Recorded new controller, from now on will use node 0.0.0.0:9093 (id: 1 rack: null) (kafka.server.NodeToControllerRequestThread)
Extracted event type:channel_manager_Recorded_new_controller_from_now_on_will_use_node_id_rack
Timestamps, IPs, and runtime values are stripped. The remaining structure becomes a cost-tracking key — no regex, no manual rules.
How message extraction works → — showing which types cost the most and where your log budget goes, broken down by type, severity, and application.
Connects to your existing log analytics platform — no agents, no forwarder changes. Deploy as a Kubernetes CronJob or AWS Lambda function.
Most teams start here. Identify cost targets with Cloud Reporter, then act with Edge Optimizer (lossless reduction) or Edge Regulator (budget caps).
Minimal — typically less than 0.1% of your platform's capacity. Cloud Reporter runs as a Kubernetes CronJob (not a persistent process), so the footprint is a periodic blip on a schedule you control.
- Read-only integration — no writes, no data modifications, no interference with alerting or search
- Configurable rate limiting with efficient sampling — no full data scans
- Off-peak scheduling — you control the schedule and concurrency
Per-platform impact:
- Splunk — scheduled search jobs during off-peak windows, tunable to minimize search head load
- Datadog — respects API rate limits with automatic backoff
- Elastic/OpenSearch — lightweight
_statsand_mappingcalls, not full-text queries
Cloud Reporter applies the same optimization engine used in production Log10x to your sampled data.
For each message pattern, it calculates reduction ratios, identifies redundant patterns, and quantifies potential volume savings. Results are presented with dollar amounts based on your actual pricing tier.
The analysis accounts for your specific log characteristics — not generic benchmarks.
Cloud Reporter integrates with major log platforms:
- Splunk
- Elastic
- Datadog
- AWS CloudWatch Logs
Each integration uses read-only API access — no agents or forwarders required. Setup takes about 15 minutes.
Need a different source? The Apache Camel integration supports 400+ data sources via declarative YAML routes.
Pricing & Getting Started
Cloud Reporter is included with every Log10x subscription at no additional cost — it’s part of the platform. See the pricing page for subscription tiers.
Start with a 14-day free trial (sign up at console.log10x.com, no sales call required).
Yes. Sign up at console.log10x.com for a 14-day free trial. No sales call required. Cloud Reporter starts analyzing your environment immediately after connecting your first data source.
Cloud Reporter deploys in your infrastructure — no data leaves your network. It runs as a Helm CronJobCloud Reporter — Helm CronJob:log10xLicense: "YOUR-LICENSE-KEY"
jobs:
- name: cloud-reporter
runtimeName: my-cloud-reporter
schedule: "*/15 * * * *"
args:
- "@apps/cloud/reporter"Full deploy guide → that samples your log platform API on a schedule. Connect your data source in the console and results appear within minutes.
Know What You'll Save
CLI · Docker · KubernetesWorks with any log platform