
Search compact logs in Splunk using the 10x app
How Splunk stores fewer bytes and still returns the original log lines.

Splunk meters the volume entering the indexing pipeline, and the usual ways to cut that volume drop lines or strip fields. Most of the volume is the same text repeated. 10x stores that text once and sends each event as its values. The 10x app expands every event back at search time, so existing classic dashboards return what they always did. The app is open source.
Dropping noisy lines, sampling and stripping fields cut Splunk volume at the cost of information. Most of that volume is repetition, though. A single log.info("User {} logged in from {}", userId, ip) call site emits the same line a million times, and only the timestamp, the user, and the IP change. Written to the index as a hash of the shared template plus those three values, the event costs a fraction of the bytes and still expands back to the original line.
A dashboard built against the original lines finds none of its search terms in the encoded events. We built 10x for Splunk to expand events back at search time, so existing classic dashboards keep returning what they always did.
Everything rests on one property, that the hash identifying a template stays stable, the same call site yielding it again every time. Templates inferred from a sliding window of live data drift as it moves and make a poor storage key. We derive the vocabulary from the format strings and class names in the application's repos, so a compile pass yields a deterministic library, and the hash holds on every node that shares that pinned library and engine version. Where that library comes from is its own post. Here I take the hash as stable across queries, deploys, and nodes sharing the library.
Compaction is lossless and specific to destinations that store the encoded form. The Splunk app in this post is MIT licensed and inspectable end to end, while the Receiver that produces the encoded events is the commercial piece.
On the public otel-sample.log, 215 MB of raw lines compact to 77 MB, a measured 64%, counting the encoded events plus the template dictionary they expand through. Round-tripping that sample returned all 197,430 lines byte-identical. Bytes that are not valid UTF-8 are substituted at the file read, before the engine tokenizes, the same substitution any UTF-8 log reader makes. Across the full measured benchmark the per-dataset spread runs 4.7% to 64% by content, so the number is a property of the stream.
At search time, a panel that yesterday showed 2026-04-14 10:23:01 INFO admin logged in from 192.168.1.1 shows ~x7Kp2m,1776162181000,admin,192.168.1.1. Every SPL query needs editing, yet we had to expand events back without touching a saved search or dashboard.
Three places to intercept
A custom search command is Splunk's official extension, and it means adding | tenxsearch to a query. As the only path it would mean editing every saved search, panel, and alert, so the app keeps it for the search bar, which nothing else reaches.
Expanding at index time sidesteps that, since the forwarder rebuilds events before indexing and everything downstream works. But it pays for the full raw stream again. On an ingest-based license, Splunk meters the raw volume entering the indexing pipeline, the very bill 10x was meant to remove.
Hooking the browser's search submission is where we landed. The hook covers classic dashboards, which run in the browser. Server-side searches never touch the browser, so they fall outside the hook. We point the URL the dashboard POSTs to at our REST endpoint, which rewrites the SPL, submits it, and returns a standard sid.
The browser hook
Splunk auto-loads dashboard.js from an app's appserver/static/ directory. Ours is 37 lines, waiting for the page and then calling TenxSearchHook.execute(true) from tenx_search_hook.js, a 62-line module. Its interception block matches both job paths, /search/v2/jobs for Splunk 9 and later and /search/jobs before that:
// tenx-for-splunk/appserver/static/javascript/search/tenx_search_hook.js
const originalSearchPaths = ["/search/v2/jobs", "/search/jobs"];
const newSearchPath = "/tenx-search";

$.ajaxSetup({
    beforeSend: function (xhr, settings) {
        if (settings.type != "POST") {
            return;
        }

        for (var i = 0; i < originalSearchPaths.length; i++) {
            var path = originalSearchPaths[i];

            if (settings.url.endsWith(path)) {
                var baseUrl = settings.url.substring(
                    0, settings.url.length - path.length);
                settings.url = baseUrl + newSearchPath;
                return;
            }
        }
    }
});
The handler creates the job through Splunk's own /search/jobs endpoint and returns the same {"sid": ...} payload that endpoint produces, so the browser gets a Splunk job ID. The rewrite fires only on the POST that opens a job, so the status polls that follow, GETs against /search/jobs/<sid>, reach Splunk unmodified.
The remaining lines handle a startup race, since some dashboards fire searches before the hook loads. Search submission in the classic framework goes through jQuery, which is what leaves a single place to intercept. The execute(true) call walks the search managers Splunk already instantiated, via SplunkJS's component registry, an internal API rather than part of the documented surface, plus startSearch({refresh: true}), and re-issues those through the intercepted path.
What /tenx-search does with the SPL
The REST endpoint is registered in restmap.conf as a persistent Python 3 handler, which hands the search to TenxSearchBuilder, resolved in four steps.
First the builder parses the SPL, calling Splunk's /services/search/parser endpoint with parse_only=true, then modifying only the leading search command so that everything after the first pipe passes through.
Next it checks for encoded data, inspecting props.conf for the REPORT-tenx = tenx-hash-vars-extraction rule that splits the encoded line into hash and variable slots, though sourcetypes lacking it fall through to native search.
Then it finds the matching templates. Each word is cut into the pieces Splunk indexes it as, at the same breakers, and each piece is looked up in tenx_dml_pure, where matches yield their hashes. An IP address is four pieces, because the pipeline stores its four octets as four values.
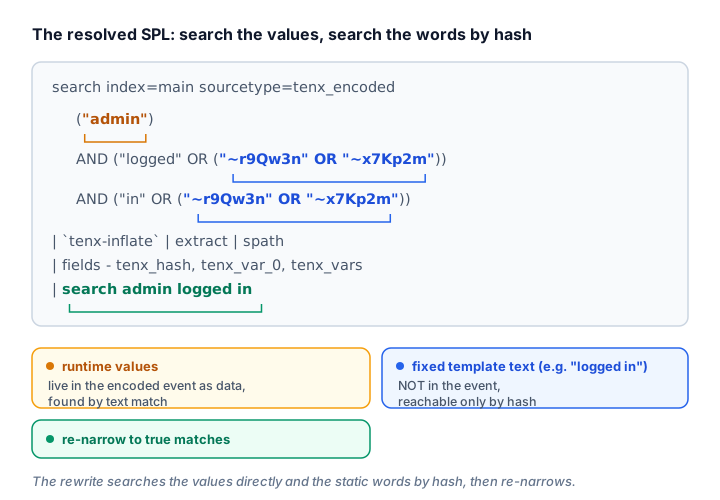
Last comes the combined search, one clause per word. In admin logged in, admin is data and appears in no template, so the event must carry it, while logged and in are template text, found in the event or by hash:
Original:
    search index=main sourcetype=tenx_encoded admin logged in

Resolved:
    search index=main sourcetype=tenx_encoded
        ("admin")
        AND ("logged" OR ("~r9Qw3n" OR "~x7Kp2m"))
        AND ("in" OR ("~r9Qw3n" OR "~x7Kp2m"))
    | `tenx-inflate`
    | extract
    | spath
    | fields - tenx_hash, tenx_var_0, tenx_vars
    | search admin logged in
A template is selected by the phrase "~<hash>", the form the event itself begins with. A test on the tenx_hash field misses every hash carrying a space or a *, because the space splits the indexed value and the * is a wildcard even inside quotes. The trailing | search drops anything whose decoded _raw lacks the original terms.
On a shape it cannot model, the parser flips to COMPLEX, one of four states alongside SUCCESS, FAILURE, and PENDING.
A search the builder cannot rewrite is refused. Run as typed on compact data it would match nothing and give no sign of it, so the job fails with a message saying why, and a dashboard panel shows that message in place of a number.
A bracketed subsearch is handed to a nested builder and resolved before the outer search is parsed. A word whose dictionary lookup runs out of time is left out of the prefilter and checked after expansion, which keeps the search correct at the cost of reading more events.
The tenx-inflate macro
tenx-inflate reconstructs events in pure SPL, with no Python. A regex in transforms.conf splits the event into hash, first variable, and the rest:
REGEX = ^~?(?<tenx_hash>[^,]+),(?<tenx_var_0>[^,]+)(?:,(?<tenx_vars>.*))?The comma split is safe because a variable value never contains one. Any comma in the source line is a delimiter, stored with the template, so the wire carries only the values between them.
The leading ~ marks an event as encoded. When the template has a timestamp, the first slot carries it, so the macro treats tenx_var_0 as the epoch.
makemv delim="," tenx_vars
| lookup tenx-dml-lookup _key AS tenx_hash
    OUTPUT part_0 AS tenx_part_0,
           pattern_parts AS tenx_log_parts,
           pattern_terminator AS tenx_log_term,
           timestamp_format AS tenx_ts_f
| eval tenx_ts_sec=if(tenx_var_0 > 10000000000000,
                       tenx_var_0 / 1000000000,
                       tenx_var_0 / 1000)
| eval _raw=if(isnull(tenx_log_term), _raw,
    if(tenx_ts_f == "",
        if(isnull(tenx_var_0), tenx_log_term,
            mvjoin(mvappend(tenx_part_0, tenx_var_0,
                mvzip(tenx_log_parts, tenx_vars, ""),
                tenx_log_term), "")),
        replace(
            mvjoin(mvappend(
                mvzip(tenx_log_parts, tenx_vars, ""),
                tenx_log_term), ""),
            "__TENX_TS__",
            strftime(tenx_ts_sec, tenx_ts_f))))
| fields - tenx_hash, tenx_log_parts, tenx_log_term,
           tenx_ts_f, tenx_part_0, tenx_var_0,
           tenx_vars, tenx_ts_sec
The lookup pulls the template's static text from the KV Store by _key. mvzip, mvappend, and mvjoin weld each segment and value back into _raw. For timestamped templates, replace swaps in a __TENX_TS__ placeholder, and a check against 10 trillion tells nanoseconds from milliseconds. A final | extract and | spath run field extraction against the rebuilt _raw, JSON included. Exact expansion needs one Receiver-side setting, varMaxRecurIndexes: 0 in the pipeline feeding Splunk, though it carries a small trade-off the app README covers.
How templates reach Splunk
Templates enter Splunk via HEC as JSON on the tenx_dml_raw_json sourcetype. Each carries a templateHash and a template like User $ logged in from $, each $ a value slot. A saved search named "Consume KV" fires every two minutes, splitting each template on $ into the tenx_dml KV Store collection and writing a flat copy to tenx_dml_pure for matching. The cron is a latency gap, since a new log format waits for the next run before it can expand.
Two expansion paths
The hook is the transparent path, serving the classic dashboards in any app that carries dashboard.js. The file ships in the 10x app, and copying it into another app extends the coverage there. The search bar loads no app JavaScript, so from Search & Reporting a search is wrapped in the app's tenxsearch command, which runs the same rewrite on the server and works in saved searches, alerts and the REST API too. The command is the slower of the two, because it writes every expanded event out itself.
Everything else expands through the macro. Scheduled alerts run server-side, where no browser hook fires, so 10x compiles them once at save time, rewriting the authored search into the same form the interactive path builds, the keyword-or-hash match piped through tenx-inflate, and storing it as a native saved search the scheduler runs unchanged.
REST calls from Python and SDK queries from external tools wrap the search in tenxsearch the same way, and code that reads events outside Splunk decodes them with the standalone Java or JavaScript decoder. Dashboard Studio, the newer React-based framework where Splunk is putting its new-visualization work, does not go through the classic jQuery stack either, so its panels use the command too.
The full app is MIT licensed at github.com/log-10x/splunk-app, and its setup guide covers install, HEC tokens, and forwarder config. Whether browser-level interception ages well as Dashboard Studio grows is the open question.
Related: why the template hash is stable, the same problem in Elasticsearch, solved one layer down inside Lucene, and the same idea on ClickHouse in plain SQL.