
How a log line gets a stable pattern ID
Why 10x identifies each log line on arrival, not by clustering at search time.

Splunk, Datadog and Elastic all work out their log patterns while a search runs. The same line can land in one group on one search and a different group on the next. An alert pinned to one of those groups comes loose. 10x gives each line an ID taken from the fixed words the code prints, leaving out every value that is not a word in its library. Nodes running the same pinned library and engine version agree on it.
Most pattern-detection in mature observability platforms runs at query time. Splunk's cluster command, Datadog's Log Patterns view, Elastic's categorize_text aggregation all work this way. Feed any of them the same log line through two different searches and you can land in two different clusters, under a grouping key that was rebuilt for that query. Fine for a dashboard, useless for tracking a pattern across queries.
Runtimes solved this for objects: V8 gives every object a hidden class, a stable descriptor of its shape, computed once and shared by every same-shaped object for the program's life. We built 10x to do the same for log events. Every event gets a template that is its hidden class.
A stable ID matters when something downstream has to stay attached to the same pattern tomorrow, like an alert on one log shape or a per-pattern cost budget.
On the 215 MB OTel-demo sample, 157,228 events collapse to 3,028 templates, a measured 64% byte reduction counting its 3.3 MB template dictionary, and the same line hashes to the same template on every node sharing the pinned library and engine version, for the lines that library covers. The sample is public. The engine that produces the hash is the paid product, and its published container image encodes the sample with one command, so a reader can encode the same line on two machines and compare the hashes.
What a symbol is
A log event's shape isn't declared anywhere: two events from different log.info(...) calls are different shapes even when they look alike. Two with the same skeleton and different runtime values are the same shape.
To tell those apart, the engine needs a symbol: a fixed string it knows came from source code, like a class name or a format string, not from runtime data. That split between structure and value is the whole trick.
The vocabulary of symbols comes from a library. 10x ships a default library built from the open-source repositories and public container images listed in its manifest. An optional compile pass scans in-house repositories and container images and adds that code. (Where the symbol library comes from is its own post.)
From line to hash
At runtime the engine tokenizes the line and labels each token as a known symbol or a variable value, drops the variable values, then computes a 64-bit FarmHash over the symbols and the delimiters between them: the brackets, quotes, and punctuation that belong to the log format.
The hash input is only library symbols; a runtime value enters it only when it is itself a library word. So the same log format produces the same template hash on every node sharing the pinned symbol library and engine version, across restarts and environments.
One line, two identities
That template hash names the exact shape of a line, and shape is finer than statement. One log.info call can print several shapes over its lifetime: a field gets appended, a wrapper adds a prefix, the timestamp format changes at a collector upgrade. Each of those is a different template with a different hash, and each still comes from one place in the code.
So the engine keeps a second identity above it. The pattern is a subset of the template: the run of symbols the engine traces back to a single source origin, kept and hashed on its own as tenx_hash. Several templates that trace to the same origin share one pattern, which makes a set of templates sit under a single name.
The two answer different questions: the template hash says which stored shape rebuilds this line, so it is the join key that makes compact storage work. The pattern says which statement in the code emitted it, so it is what a per-pattern budget, a routing rule, or a cost report keys on. A budget written against a template hash splits the moment the format shifts under it. Written against the pattern, it holds through the shift.
One line from the OTel-demo sample shows the split. Grafana's alert sender writes this 623 times:
logger=ngalert.sender.router rule_uid=des78nlna99tsf org_id=1 t=2025-10-01T20:13:00.042088606Z level=info msg="Sending alerts to local notifier" count=1Go writes fractional seconds without trailing zeros, so the same statement prints timestamps of four different widths, and each width is a different shape with its own template hash:
t=$(yyyy-MM-dd'T'HH:mm:ss.SSSSSSSSS'Z')   562 events
t=$(yyyy-MM-dd'T'HH:mm:ss.SSSSSSSS'Z')     55 events
t=$(yyyy-MM-dd'T'HH:mm:ss.SSSSSSS'Z')       5 events
t=$(yyyy-MM-dd'T'HH:mm:ss.SSSSSS'Z')        1 event
Four templates, four hashes, all tracing to one line of Grafana, so all four sit under one pattern. A cost report keyed on the pattern counts all 623. Keyed on a template hash it counts 562 and misses the rest without saying so.
An example from the OTel-demo sample
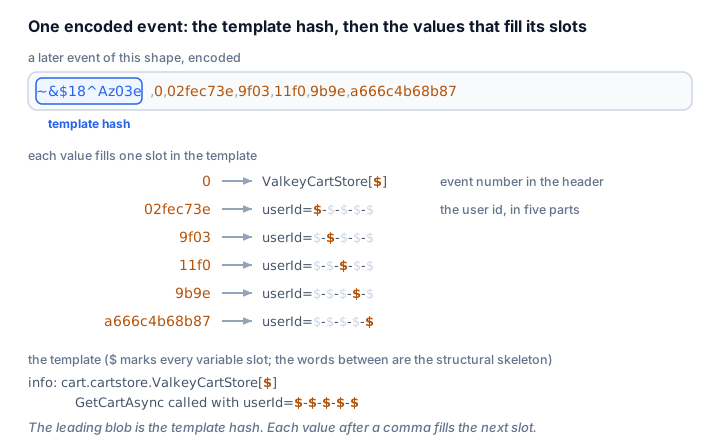
Here's a cart-service event from the OTel-demo sample that ships with 10x, abridged to its log message (the JSON envelope and kubernetes metadata get templated too). The .NET console logger prints a header line and then the message, and the engine reads the pair as one event:
info: cart.cartstore.ValkeyCartStore[0]
      GetCartAsync called with userId=02fec73e-9f03-11f0-9b9e-a666c4b68b87
The first time this shape appears, the engine extracts the template ($ marks each variable slot):
info: cart.cartstore.ValkeyCartStore[$]
      GetCartAsync called with userId=$-$-$-$-$
Every later event becomes its template hash plus the values that filled the slots:
~&$18^Az03e,0,02fec73e,9f03,11f0,9b9e,a666c4b68b87The leading blob is the template hash, followed by the header's event number and the five parts of the user id. Across the full 215MB OTel-demo log file, 157,228 events distill into 3,028 unique templates and 74.1MB of encoded events: a measured 64% byte reduction counting the 3.3MB template dictionary that travels with them.
The pattern comes from the message line: GetCartAsync_called_with_userId, traced to ValkeyCartStore.cs. All three statements in the cart service print the same header, so a pattern read from the header would put them in one group; measured against the code that wrote each line, the three get three patterns. An anonymous session prints the same statement with an empty user id, which makes a second template under the same pattern.
The reduction is what gets quoted, and the determinism is what the rest of the system is built on. (Log events have class knowledge covers what opens up once every event has a stable identity.)
The symbol frequency cap
The instinct is to weight toward the symbols that show up most often. I'd argue the opposite, and built the engine to argue it: the more places a symbol appears, the less useful it is for picking the right origin.
Take Logger, which appears in hundreds of files in any Java application, so it narrows the candidates from "everything" to "everything." Take BillingReconciler, three places maybe: seeing it narrows the search dramatically.
So we capped it: the engine's default maxSymbolUnitsPerToken is 128, the most source locations it considers for any one symbol. We tried raising it later for accuracy, and it doesn't help: the extra slots fill with exactly the high-frequency noise the cap was keeping out. I'd have a hard time making a stronger claim about anything else in the engine.
Where to look
The full 215 MB OTel-demo sample is published as a release asset on the open-source config repo, with an 8 MB gzip alongside. The full runtime API reference is at doc.log10x.com. For code that already holds encoded events, standalone Java and JavaScript decoders rebuild the original lines. The claim to hold against all of this: the same line hashes to the same template on every node sharing that pinned library and engine version, or the architecture is wrong.